

TLDR: Most AI projects never prove their value, and the reason is measurement, not the technology. This guide gives enterprises the complete method: the McKinsey five-layer framework, the single-project ROI math with a worked example, current benchmarks from PwC, Deloitte, BCG, and Wharton, and the discipline that separates the firms that get returns from the ones that do not.
Table of Contents
- Why Most AI Projects Never Show a Return in 2026
- A Single ROI Number Is the Wrong Question
- The Five-Layer Framework: How to Measure AI Value
- How to Calculate ROI for One Project
- What the Market Actually Returns
- Five Metrics That Prove ROI to Your Board
- The Discipline That Makes It Work
- Frequently Asked Questions
- Sources
1. Why Most AI Projects Never Show a Return in 2026
Adoption of AI is near universal. Measured value is not. The gap between the two is the single most important fact about AI investment right now.
McKinsey's latest State of AI survey found only 39% of organizations report measurable enterprise-level EBIT impact from AI, and roughly 6% qualify as high performers who get more than 5% of EBIT from it. PwC's 29th Global CEO Survey of 4,454 CEOs paints the same picture from the corner office: 56% say AI has delivered no significant financial benefit, and only 12% report both cost and revenue gains. Deloitte reports 88% use AI but only 20% attribute real revenue growth to it. Stanford HAI's 2026 AI Index counts $285.9 billion in U.S. private AI investment for 2025, up 127.5% in a single year.
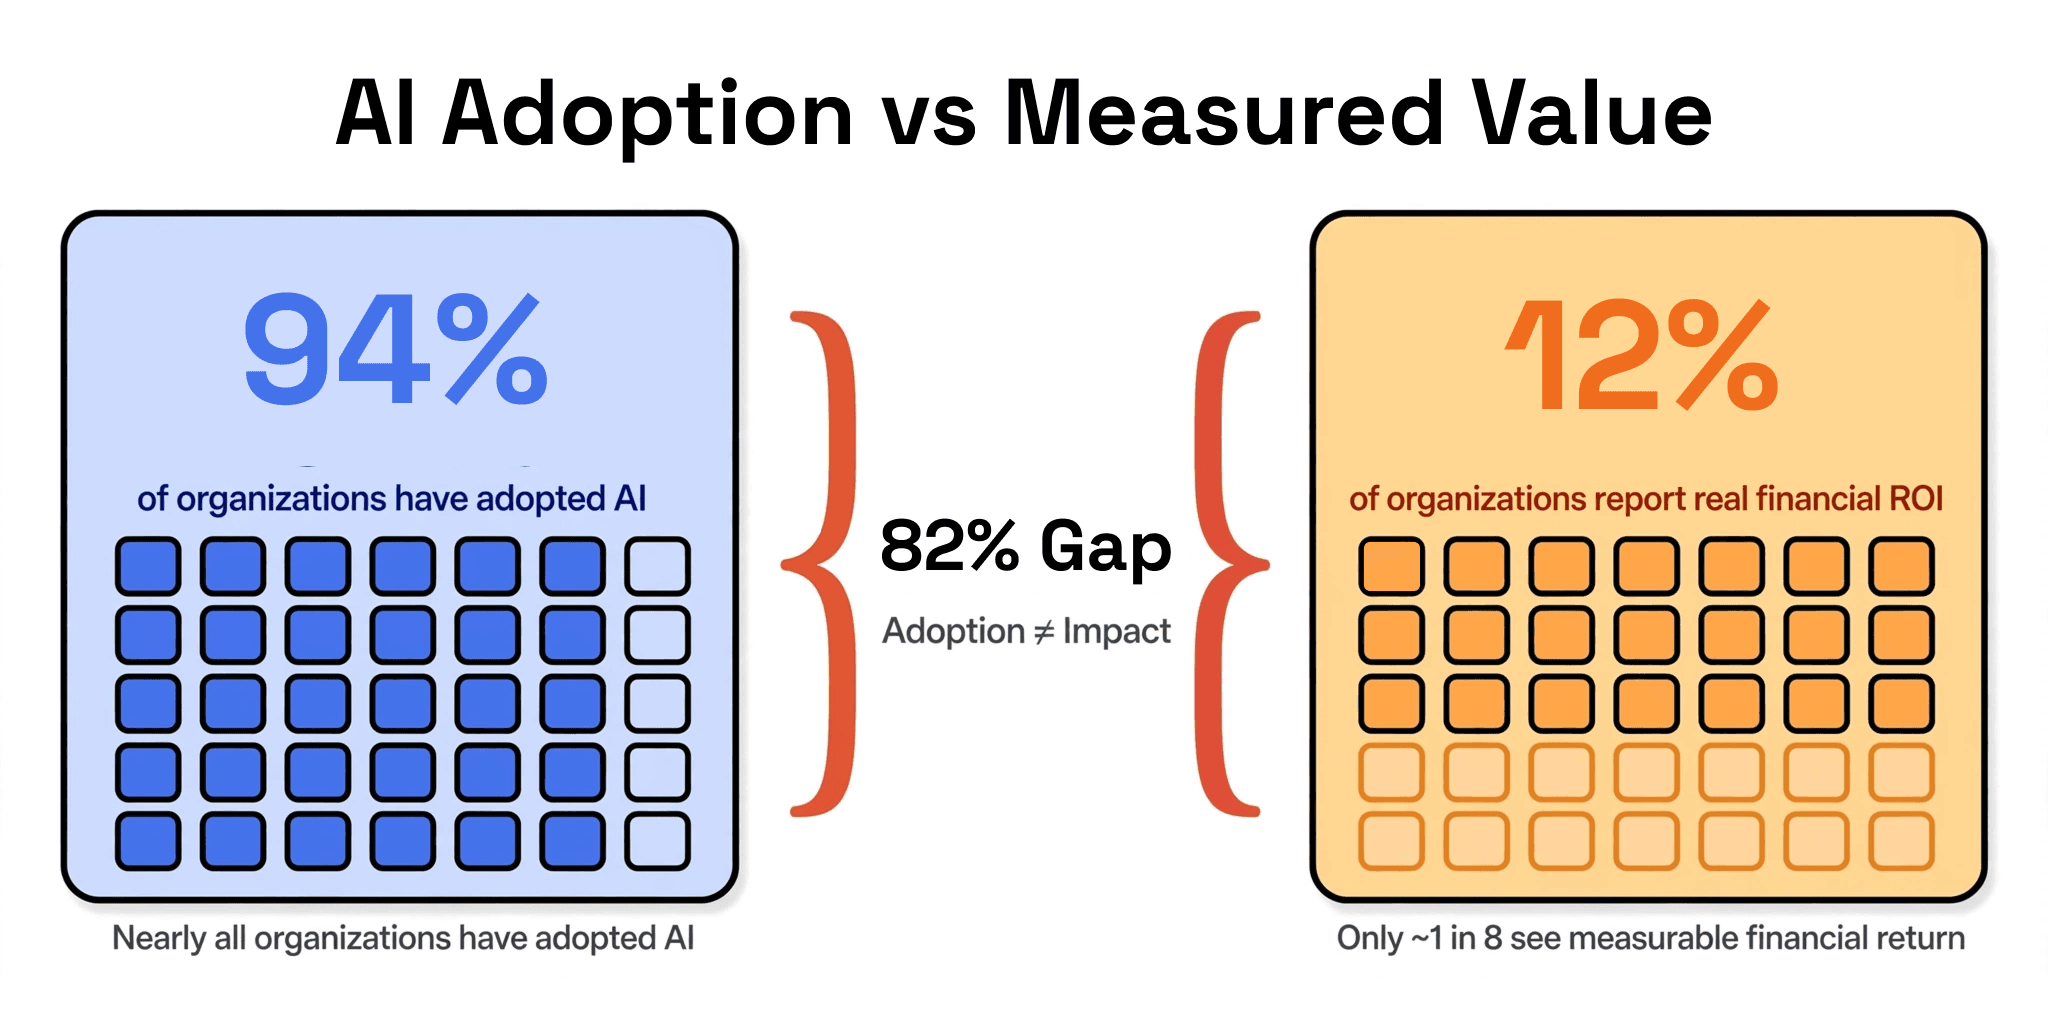
The pattern holds across every credible study. Firms deploy AI, measure little, and report modest gains. The 12% who see both cost and revenue benefits behave differently. PwC finds they are two to three times more likely to have embedded AI across products, services, and decision-making, and companies with strong AI foundations are three times more likely to report returns.
The failure is a measurement failure more than a model failure. Most projects treat ROI as a slide in a business case rather than a running discipline. The fix is a framework that ties model behavior to the P&L.
2. A Single ROI Number Is the Wrong Question
Gartner's research with CFOs is blunt about this. AI does not follow one cost curve, and it does not produce one kind of value. A single ROI formula will misjudge the portfolio.
Treat the portfolio like a mix of three bet types:
- Routine productivity
- Example: Copilots, summarizers, task automation
- Cost Profile: Low, predictable
- Timeline: Months
- Process improvement
- Example: AI inside a defined workflow, like claims or customer service
- Cost Profile: Medium, variable
- Timeline: 6 to 18 months
- Transformational
- Example: New products, new business models
- Cost Profile: High, uncertain
- Timeline: 2 to 3 years
Gartner also warns that nonfinancial value shows up first, in better decisions and faster adaptation, months before the P&L reflects it. An evaluation that only scores revenue and cost writes the project off just as it starts to pay.
3. The Five-Layer Framework: How to Measure AI Value
McKinsey's five-layer framework gives every level of the company a metric it owns and a named owner.
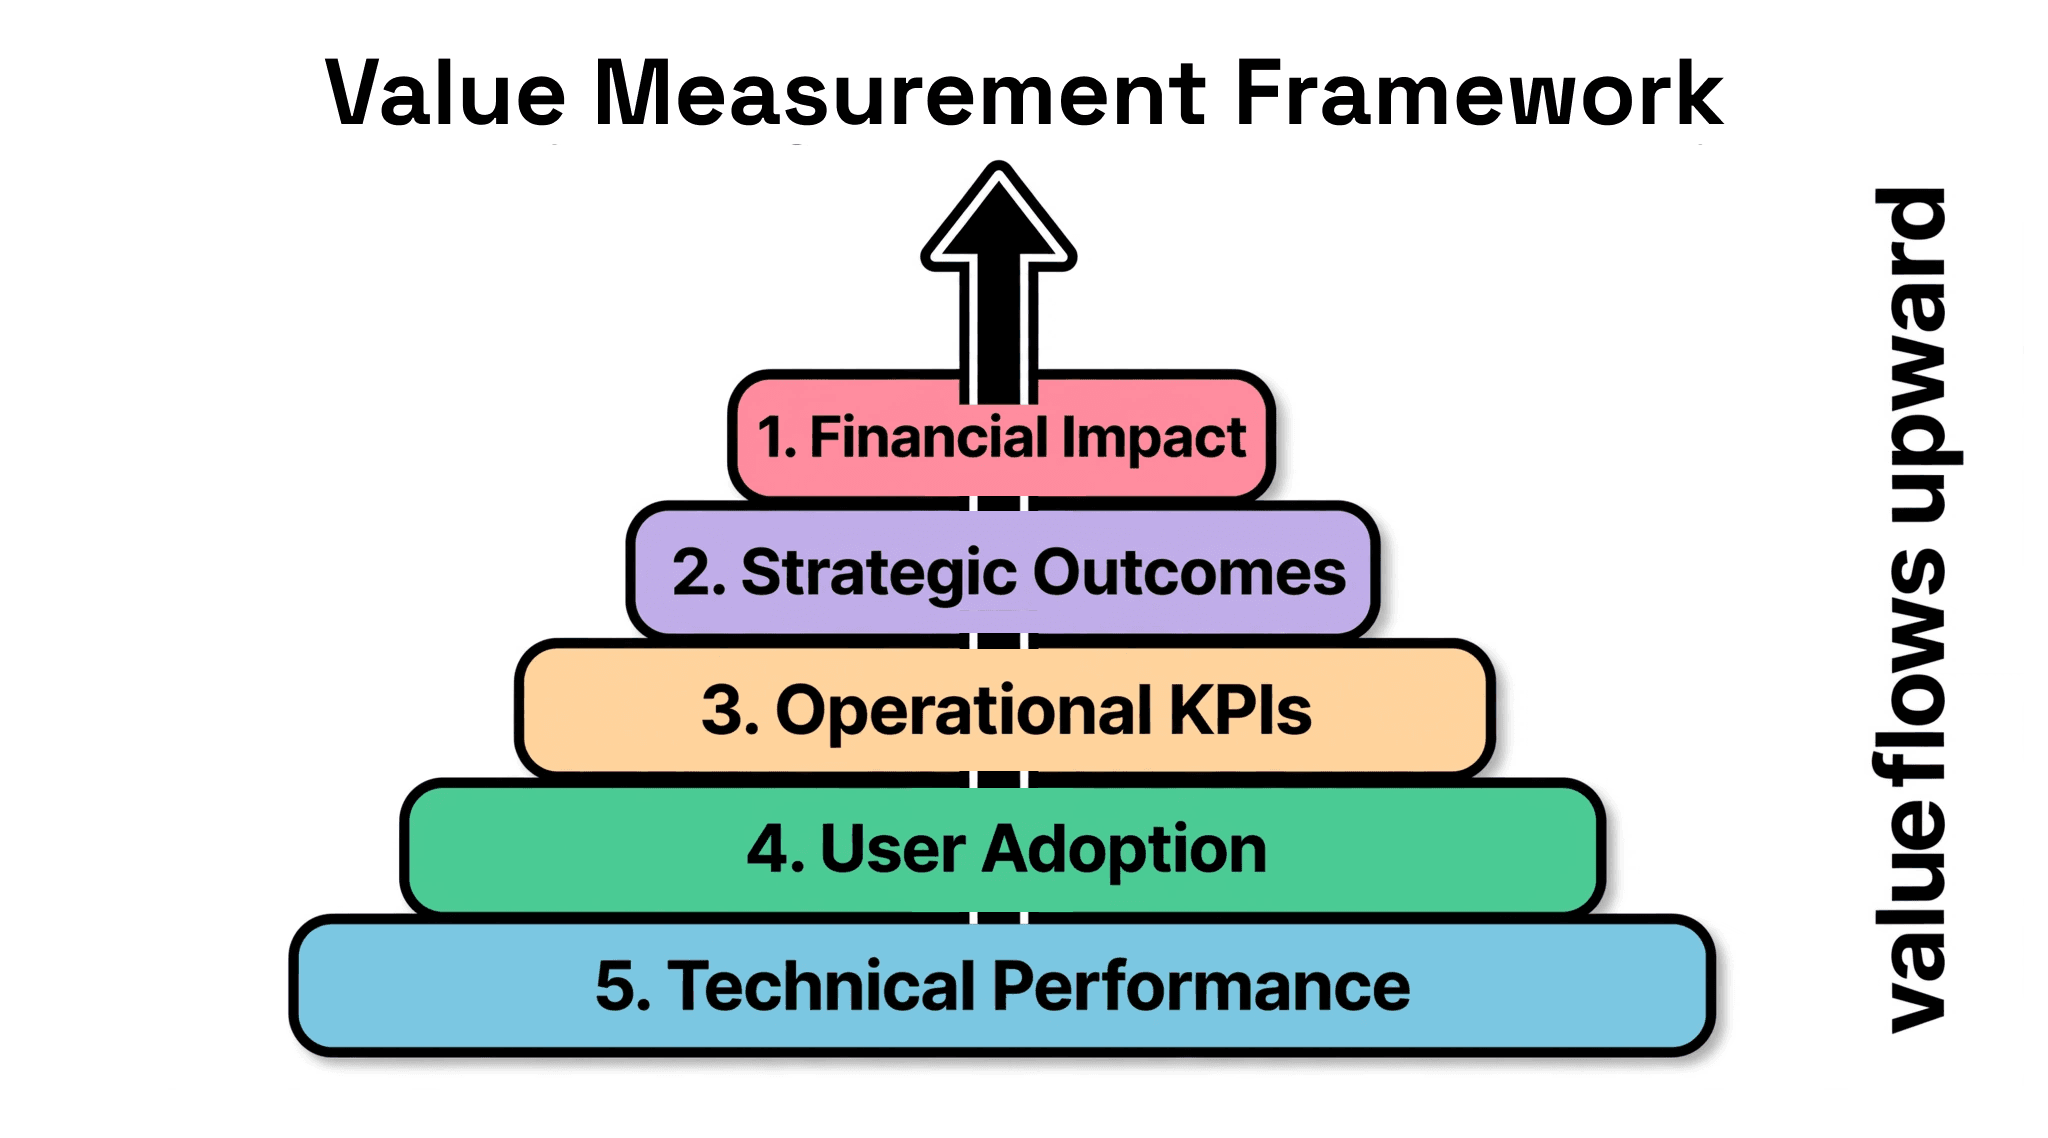
Financial impact
- What It Measures: Revenue uplift, cost to serve, margin, total cost of ownership
- Who Owns It: Finance
Strategic outcomes
- What It Measures: NPS, retention, on-time delivery, compliance
- Who Owns It: Business unit leader
Operational KPIs
- What It Measures: Cycle time, cost per ticket, first-contact resolution, defect rate
- Who Owns It: Process owner
User adoption
- What It Measures: Daily active users, workflow penetration, acceptance vs. override rate
- Who Owns It: Product and frontline ops
Technical performance
- What It Measures: Hallucination rate, latency, token cost, model drift
- Who Owns It: Data science and engineering
Layer 5 is the foundation, not the value. A model that is safe and fast but unused changes nothing. Most value capture fails at Layer 4, where adoption stalls. Layer 3 is where the business changes: cycle times fall, cost per ticket drops. Layer 2 connects those changes to business outcomes. Layer 1 is where benefits and costs sit in the same ledger, and where ROI withstands scrutiny.
The framework only works with governance. McKinsey pairs it with a monthly and quarterly cadence, a single evidence pack that tracks benefits, total cost of ownership, adoption, and technical health, and stage gates where a project must show progress before receiving more funding. Projects advance through pilot, MVP, initial scaling, and full scale, and only the ones that prove value at one layer move to the next.
4. How to Calculate ROI for One Project
Set up the ledger before you start. These numbers are placeholders.
The cost stack.
- Build: engineering time, model access, integration, data work, change management.
- Run: inference and token spend, hosting, monitoring, maintenance, retraining.
The benefit stack.
- Cost avoided: headcount freed, rework and defects cut, cost per transaction reduced.
- Revenue gained: conversion lift, faster time to market, retention improvement.
- Margin: the same output with fewer inputs.
How to measure the cost side.
The ledger needs unit economics, not just totals. Three numbers cover most AI projects.
Token cost. LLM pricing is per token, billed separately for input and output:
Cost = ((input tokens × input price per 1M) + (output tokens × output price per 1M)) ÷ 1,000,000
For the support copilot, each ticket consumes 60,000 input and 6,000 output tokens at $3 and $15 per million, or $0.27 per ticket.
Cost per unit. Token spend scales with usage, not with your plan, which is why the number that catches overruns is:
Cost per resolved ticket = total annual run cost ÷ tickets handled
At $160,000 of run cost against 500,000 tickets, that is $0.32 each. Double the volume and the token line doubles, while a license-based tool stays flat. Gartner flags this as the cost curve difference behind budget overruns.
Total cost of ownership. Spread the one-time build over the project life and add recurring run costs. McKinsey tracks this as cloud spend, token spend, and licensing. Gartner adds that licenses are a fraction of the real bill, since the hidden drivers are integration, governance, data, and change. Budget for those or the first budget review surprises you.
Agent Value Multiple. Gartner's next-generation metric for agent economics is:
AVM = (cost savings + incremental revenue + margin improvements) ÷ total cost
It measures value per dollar of AI spend and is positioned as the successor to "time saved" in board reporting. For the copilot, $500,000 of benefit against $245,000 of annualized cost gives an AVM near 2.0, the same story as the 104% ROI, told in multiples.
Vendor pricing models. Providers bill by consumption, by conversation, or by outcome. Outcome-based shifts risk to the vendor. Match the model to how predictable the use case is.
Estimate annual benefit and cost, then run three numbers: ROI, payback, and net present value.
Worked example: a customer support copilot.
Build: three engineers for four months at $12,000 a month fully loaded, model and integration work at $80,000, and change management at $30,000. Total, $254,000.
Run: inference and hosting at $120,000 a year plus maintenance at $40,000. Total, $160,000.
Benefit: the Copilot resolves 35% of tier-1 tickets, freeing eight support staff at $55,000 fully loaded, $440,000 a year, and faster resolution lifts retention by one point, worth $60,000. Total, $500,000.
Annualized cost. Build spread over three years, $85,000, plus run cost, $160,000. Total, $245,000.
ROI = (500,000 - 245,000) / 245,000 = 104% per year. Payback lands around seven months. Discount the three-year benefit stream at 12% and the net present value is clearly positive.
Two cautions keep the number honest. Do not close the denominator early. Count every cost, including your own team's time. Attribute honestly with A/B tests or staggered rollout. McKinsey calls this the difference between a business case that gets reinforced and one that gets reopened.
5. What the Market Actually Returns
The benchmarks are more encouraging than the headlines.
Wharton's Year Three report surveyed 801 enterprise decision makers. 72% now formally measure ROI, and 74% report positive returns. Tech and telecom lead at 88% positive, banking and financial services at 83%, retail trails at 54%. Nearly two-thirds budget $5 million or more.
BCG's AI Radar 2026 found companies plan to double AI spending from 0.8% to about 1.7% of revenue, and four of five CEOs are more optimistic about AI ROI than a year ago.
Deloitte adds the nuance: 66% report productivity gains and 38% cost reduction, but only 20% see revenue growth.
- 74% of measured firms report positive ROI; 72% now measure
- 56% of CEOs see no financial benefit; 12% see both cost and revenue gains
- 66% productivity gains, 20% revenue growth
- 39% see EBIT impact; ∼6% are high performers
- AI spend to double to 1.7% of revenue in 2026
Put together, the contradiction resolves. The 74% of Wharton firms who measure formally report positive ROI. The 56% of PwC CEOs who see no benefit did not embed AI at scale or build the foundations. The same gap shows in McKinsey's data: 39% see EBIT impact, 6% see real money. The differentiator is measurement and embedding.
6. Five Metrics That Prove ROI to Your Board
Gartner identifies five outcome metrics that work in the boardroom. Activity measures like time saved or prompts run do not. Pick the two or three that match your goal.
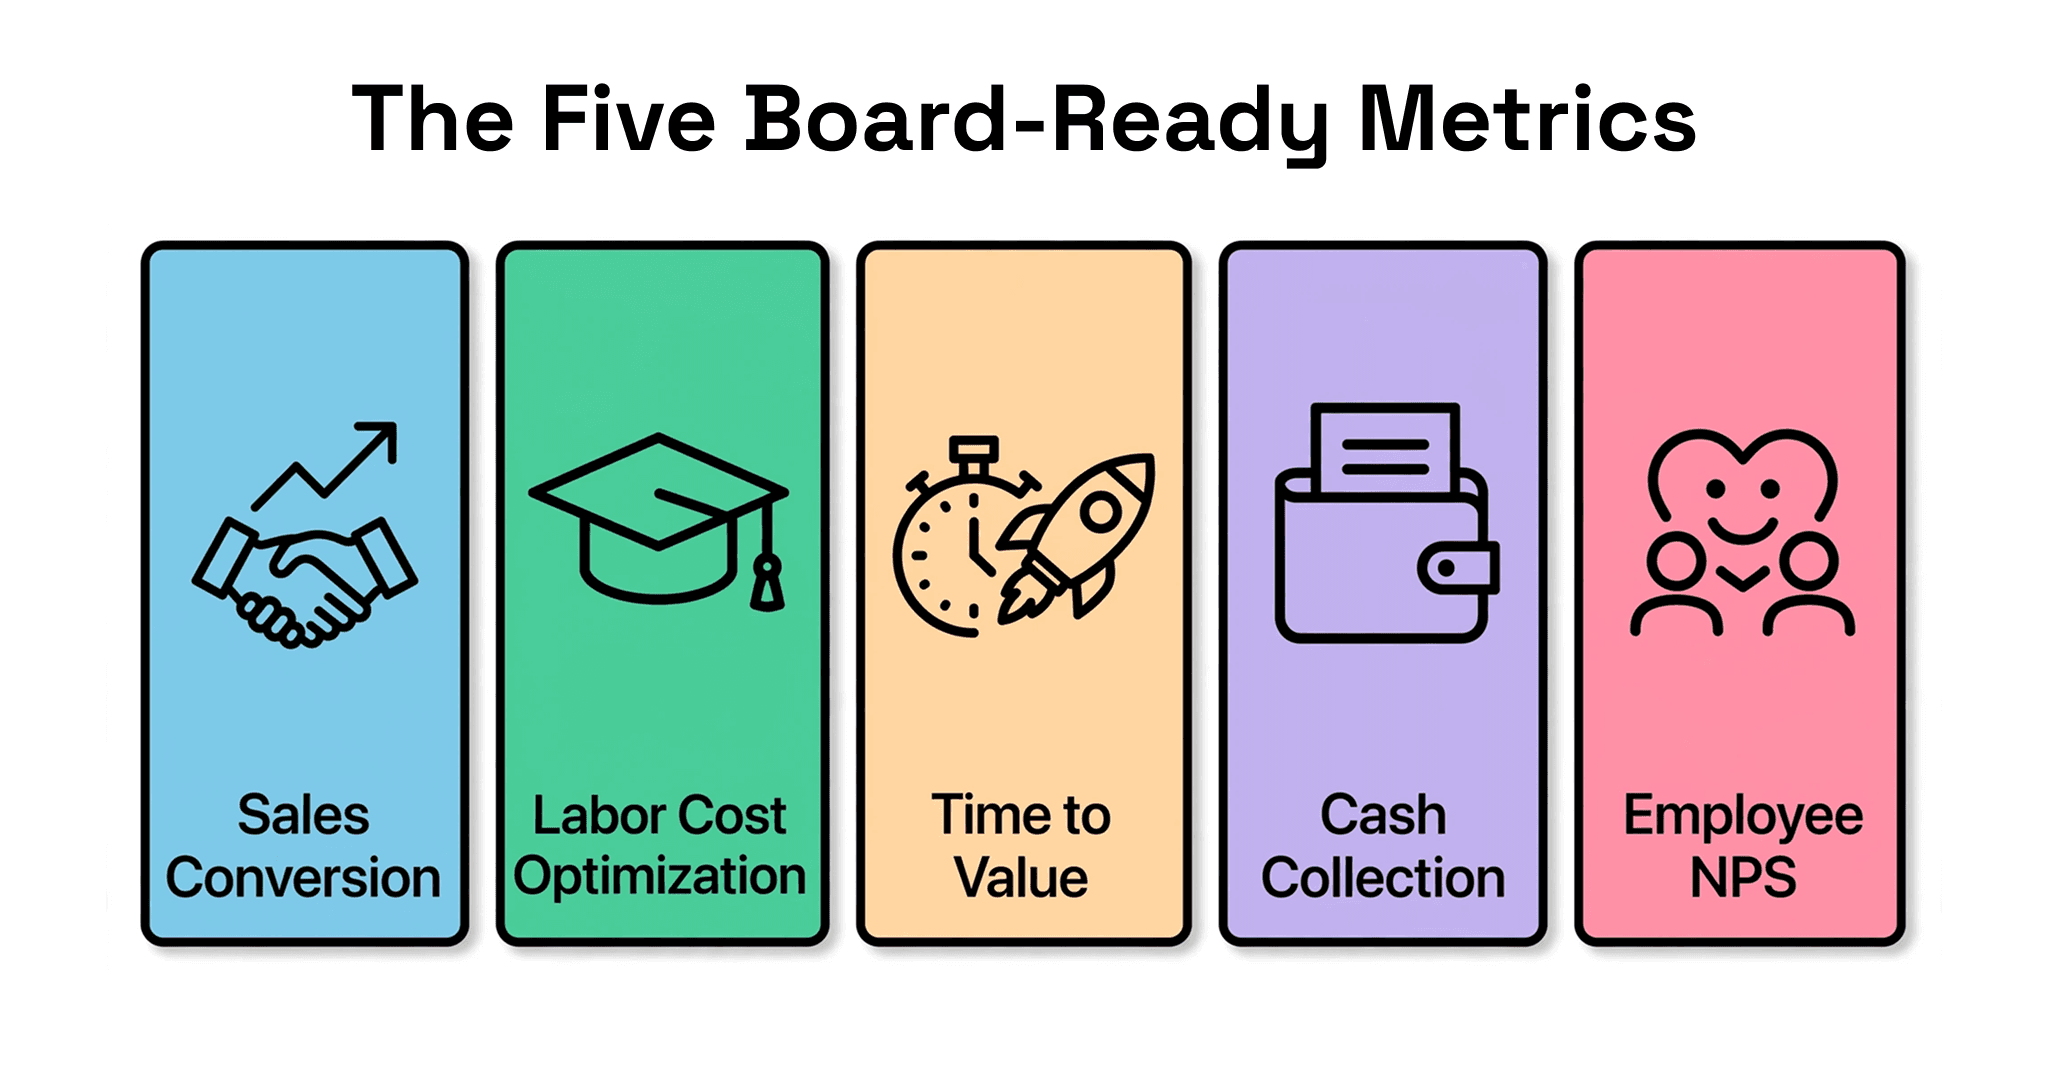
- Sales conversion. AI reads customer signals and guides sellers in real time. Revenue impact within weeks. Pick this for growth goals.
- Labor cost optimization. AI compresses experience, letting less senior staff perform like veterans. Results within a quarter. Pick this for cost goals.
- Time to value. AI shortens launch cycles, compounding earlier revenue and more iterations. Pick this for speed goals.
- Cash collection. AI drafts personalized collection communications, cutting exceptions and days outstanding. Pick this for cash flow goals.
- Employee NPS. Workers who use AI regularly report higher engagement, a retention and health signal. A 6- to 12-month play.
Pick two or three aligned to your goal, not all five. Gartner says targeted AI investments drive one outcome effectively. Start with a quick win, then layer in strategic measures.
7. The Discipline That Makes It Work
The framework and the math fail without an operating rhythm.
Run a monthly and quarterly cadence, with weekly spot checks on adoption during the first months of a rollout. Keep a single evidence pack holding benefits, total cost of ownership, adoption, and technical health in one document, so the business case is never rebuilt from scratch. Enforce stage gates. Before each scale decision, the project must show progress on agreed metrics. If ROI is not evident at initial scaling, stop or reframe.
BCG's survey adds the leadership condition. Firms that manage for and track tangible outcomes are positioned to capture ROI. About 15% of CEOs are Trailblazers who upskill their workforce and reinvest early returns. Everyone else waits for evidence that only measurement creates.
Start the discipline before the project. Define the value hypothesis, lock the attribution method, and set the gates before you write the first prompt.
8. Frequently Asked Questions
How many AI projects actually return value?
It depends on how you measure. Wharton finds 74% of firms that formally measure report positive ROI. PwC finds 56% of all CEOs see no significant benefit. The gap is measurement and embedding.
What is a realistic payback period?
Routine productivity tools can pay back in a quarter. Process bets run 6 to 18 months. Transformational bets run two to three years.
Should ROI include nonfinancial value?
Yes, but report it separately. Gartner says AI value often appears first in better decisions and capability, before the P&L moves.
Do we need a separate AI finance function?
No. You need finance ownership of the financial layer and a named owner at every other layer. The ownership table in the framework is the function.
9. Sources
An ROI model is only worth something when the project ships. Most AI programs stall between business case and delivery, and closing that gap is a portfolio management problem more than a technology problem.
If your AI portfolio needs the discipline to move from pilot to delivered value, book a session with Realization. See Concerto in action.